The human skin is very sensitive to temperature. When the skin temperature reaches 45°C, the person will have a burning feeling. When the temperature reaches 72°C, it will cause second-degree burns to the skin.
Alice Stoll and Maria Chianta in the latter half of 1960s, conducted a series of experiments on live, anesthetized test subjects. They recorded the time required for a given heat source at which the onset of pain occurred, producing minimal blistering within 24 hours. Simply put, the time duration in seconds to produce a second-degree burn was recorded at different heat intensities (heat flux).
This data was then quantified in simple and measurable terms. The duration to produce a second-degree burn was translated to rise in temperate of a copper calorimeter, for the same duration and using the same heat source (intensity). The plot resulting from this experiment is referred to as Stoll curve in recognition of the researcher Alice Stoll.
A modified form of the Stoll curve is shown in Figure 1. Here the blue curve represents the time to second degree burn at different heat intensity (heat flux) while the red curve represents the corresponding temperature rise on a copper calorimeter.
The Stoll method has advantage of simplicity as it does not need sophisticated numerical calculation to estimate burn injury. Therefore, the Stoll curve can be used to predict second burn time by comparing with the temperature rise of copper calorimeter. This is now used to assess the risk of burns from Heat and Flame hazards like electrical arc flash.
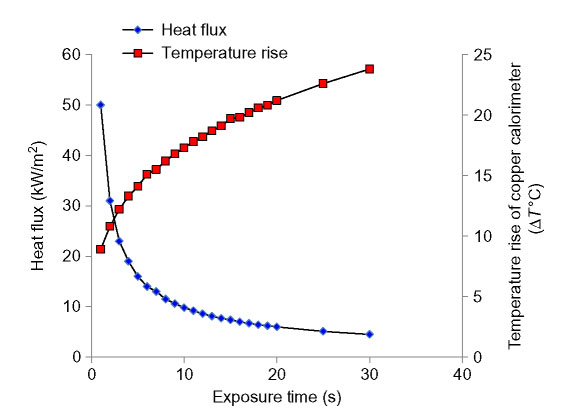
Figure 1: Modified Stoll Curve – (S. Mandal, G. Song, Thermal sensors for performance evaluation of protective clothing against heat and fire: a review, Text. Res. J. 85 (1) (2015) 101-112.)
The Stoll curve is a valuable tool for safety engineers and product designers. For example, it can be used to calculate the amount of energy that a worker is exposed to during an arc flash event and to determine the appropriate level of arc flash protection that is needed.
The Stoll curve has also been used to develop standards for arc flash protection. For example, the National Fire Protection Association (NFPA) 70E standard for electrical safety requires that electrical equipment be evaluated using the Stoll curve to determine the appropriate level of arc flash protection.
For simple explanation to the application of the Stoll curve, we refer to Figure 2, which shows the plot of ATPV testing of 3 fabrics. With the help of the Stoll curve, it can be easily determined that fabrics B and C are able to protect the user against a specific hazard while fabric A isn’t. This is because fabric A crosses the Stoll curve, thus exposing the user to a heat intensity which can lead to a second-degree burn. Thus this method is simple in the evaluation of protective clothing against heat and flame hazards.
Lastly, there is also a downside to this method. The Stoll second-degree burn technique is based on limited data obtained in specific conditions and that it only provides information on predicted (may or may not create) second degree burns.
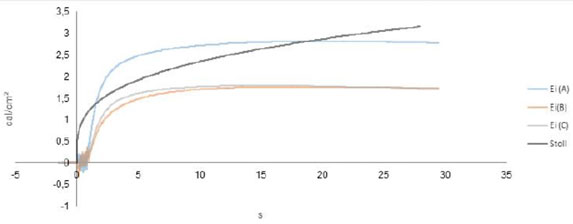
Figure 2: Temperature vs Time plot of ATPV tests done on fabrics along with standard Stoll curve.
Leave a Reply